The science behind RHCs liver thread
- Thread starter Ivan Dobsky
- Start date
-
Please bear with us on the new site integration and fixing any known bugs over the coming days. If you can not log in please try resetting your password and check your spam box. If you have tried these steps and are still struggling email [email protected] with your username/registered email address
-
You are using an out of date browser. It may not display this or other websites correctly.
You should upgrade or use an alternative browser.
You should upgrade or use an alternative browser.
Bit sick of the climate change debate. Change the record and argue about something else.
I posted about the blank sun and the low solar cycle, with one line and a graph at the end, of my own addition, relating to solar cycles and weather patterns, then the scientifically illiterate clown fish turned it into a mess because that's what he likes to do.

All science related until the ****** appeared
Grand solar minimum, if this is one, is something we've yet to experience in the modern age of records and data that is forever, a golden opportunity, and hopefully a benign one!
You must log in or register to see images
Grand solar minimum, if this is one, is something we've yet to experience in the modern age of records and data that is forever, a golden opportunity, and hopefully a benign one!
I posted about the blank sun and the low solar cycle, with one line and a graph at the end, of my own addition, relating to solar cycles and weather patterns, then the scientifically illiterate clown fish turned it into a mess because that's what he likes to do.
You posted a graph you didn't understand and tried to claim it supported an incorrect position then started attacking everyone [HASHTAG]#standard[/HASHTAG]
You posted a graph you didn't understand and tried to claim it supported an incorrect position then started attacking everyone [HASHTAG]#standard[/HASHTAG]
No
You must log in or register to see images
relates to the article on solar cycle, the correlation is far better than CO2.
IPCC estimates climate sensitivity at 1.5˚C to 4.5˚C, but that estimate is based on computer climate models that failed to predict the absence of warming since 1995and predicted, on average, four times as much warming as actually occurred from 1979 to the present.
You don't have any clue what you are on about. AGW is solely based on a correlation of CO2 and temperatures, and I offered a better correlation. Like it or lump it, the correlation is superior to that of CO2 and that [HASHTAG]#triggered[/HASHTAG] you
So your graph has three data points ("warm", "cold/snow", "cold/snow") across 19 years. Convincing.
So your graph has three data points ("warm", "cold/snow", "cold/snow") across 19 years. Convincing.
You don't even know what you are looking at, and you say something is incorrect when you don't even know anything about the subject

You must log in or register to see images
"So your graph has three data points ("warm", "cold/snow", "cold/snow") across 19 years"
clearly you are an idiot. The "warm" you call "warm" is the highest point of solar activity since before the little ice age
The "cold" and "snow" were modern record RECORDS of cold and snow after 30 years of claims this is not possible any more
They are dips in solar cycle activity, something you claim has no effect yet the correlation.. tut tutMid to late 20th century warming, as below circled, solar activity.
You must log in or register to see images
careful you don't drown.
STOP IT!!!!!
while I agree this is not needed, and silly, who the **** are you to be ordering anyone around

You don't even know what you are looking at, and you say something is incorrect when you don't even know anything about the subject
You must log in or register to see images
"So your graph has three data points ("warm", "cold/snow", "cold/snow") across 19 years"
clearly you are an idiot. The "warm" you call "warm" is the highest point of solar activity since before the little ice age
The "cold" and "snow" were modern record RECORDS of cold and snow after 30 years of claims this is not possible any more
Mid to late 20th century warming, as below circled, solar activity.
You must log in or register to see images
careful you don't drown.
So how about plotting solar cycle versus snowfall or temperature rather than just labelling 3 times in 19 years that they happen to agree? Oh, because that would prove your argument is false.
And you keep falling back on the argument that global warming means no more snow. [HASHTAG]#sortyourstoryout[/HASHTAG]
while I agree this is not needed, and silly, who the **** are you to be ordering anyone around
I'm your superior in every respect. Discuss that, ****chops

Estimating Solar Irradiance Since 850 CE
Abstract
Solar total and spectral irradiance are estimated from 850 to 1610 by regressing cosmogenic irradiance indices against the National Oceanic and Atmospheric Administration Solar Irradiance Climate Data Record after 1610. The new estimates differ from those recommended for use in the Paleoclimate Model Intercomparison Project (PMIP4) in the magnitude of multidecadal irradiance changes, spectral distribution of the changes, and amplitude and phasing of the 11‐year activity cycle. The new estimates suggest that total solar irradiance increased 0.036 ± 0.009% from the Maunder Minimum (1645–1715) to the Medieval Maximum (1100 to 1250), compared with 0.068% from the Maunder Minimum to the Modern Maximum (1950–2009). PMIP4’s corresponding increases are 0.026% and 0.055%, respectively. Multidecadal irradiance changes in the new estimates are comparable in magnitude to the PMIP4 recommendations in the ultraviolet spectrum (100–400 nm) but somewhat larger at visible (400–700 nm) and near‐infrared (700–1,000 nm) wavelengths; the new estimates suggest increases from the Maunder Minimum to the Medieval Maximum of 0.17 ± 0.04%, 0.030 ± 0.008%, and 0.036 ± 0.009% in the ultraviolet, visible, and near‐infrared spectral regions, respectively, compared with PMIP4 increases of 0.17%, 0.021%, and 0.016%. The uncertainties are 1σestimates accruing from the statistical procedures that reconstruct irradiance in the Medieval Maximum relative to the Modern Maximum, not from the specification of Modern Maximum irradiances per se. In the new estimates, solar irradiance cycle amplitudes in the Medieval Maximum are comparable to those in the Modern Maximum, whereas in the PMIP4 reconstruction they are at times almost a factor of 2 larger at some wavelengths and differ also in phase.
Introduction
Solar irradiance is Earth’s primary energy input. It establishes the thermal and dynamical structure of the terrestrial environment and is the primary external cause of terrestrial variability. The specification of solar irradiance over multiple centuries is requisite input for numerical simulations of climate variability prior to the industrial epoch that provide a baseline against which to evaluate contemporary anthropogenic influences. For this purpose, the Paleoclimate Model Intercomparison Projects PMIP3 (Schmidt et al., 2011, 2012) and PMIP4 (Jungclaus et al., 2017) developed reconstructions of the Sun’s total and spectral irradiance since 850 CE that are compatible with the absolute scale and variability of irradiance inputs recommended for climate change simulations in the subsequent industrial epoch (Lean, 2009; Matthes et al., 2017).
Because reliable, accessible, ongoing solar irradiance specifications are necessary for a range of Earth science research and applications, the U.S. National Oceanic and Atmospheric Administration (NOAA) implemented the Solar Irradiance Climate Data Record (CDR, Coddington et al., 2016) in 2015. The Solar Irradiance CDR includes estimates of total and spectral solar irradiance made using models constructed to replicate variations in contemporary space‐based observations. Currently, the NOAA CDR irradiance specifications (v02r01) extend from 1610 to the present but not, as yet, from 850 to 1610.
Continuous space‐based observations of total solar irradiance (TSI) began in late 1978, when the Nimbus 9 satellite carried the Hickey‐Freidan solar radiometer into Earth orbit, followed in 1980 by the launch of the Active Cavity Radiometer Irradiance Monitor on the Solar Maximum Mission. Thereafter, a dozen or more solar radiometers on space‐based platforms have continued the record, including the Total Irradiance Monitor (TIM) on the Solar Radiation and Climate Experiment (SORCE, Rottman, 2005) whose observations enable the model that specifies TSI for the NOAA CDR. Lean (2017) summarizes the space‐based historical irradiance observations; the record continues with the recently launched state‐of‐the‐art TIM of the Total and Spectral Solar Irradiance Sensor (TSIS) on the International Space Station (Richard et al., 2011).
Compared with the database of TSI observations, that of spectral irradiance observations is more limited in temporal coverage, has less certain absolute calibration, and reduced repeatability, especially on decadal time scales. Thus far, spectral irradiance observations over multiple cycles exist only at ultraviolet wavelengths less than 400 nm albeit discontinuously. The launch of the Solar Mesosphere Explorer (Rottman, 2006) in 1980 initiated systematic ultraviolet irradiance observations for a decade. Solar spectroradiometers on the Upper Atmosphere Research Satellite continued the record from 1992 to 2003 (Dessler et al., 1998), on SORCE from 2003 to the present (see Lean, 2017, for overview) and on the International Space Station into the future (Richard et al., 2011). Additional observations of solar spectral irradiance made in pursuit of ozone concentration measurements, such as by the Ozone Monitoring Instrument, also contribute to the solar spectral irradiance database (Marchenko et al., 2016). Systematic, continuous observations of solar spectral irradiance at wavelengths from 400 to 2000 nm exist only since 2003, made by the Solar Irradiance Monitor (SIM, Harder et al., 2009) on SORCE.
Models that combine the influences of the two primary solar sources of irradiance variability, namely dark sunspots and bright faculae, reproduce the observed space‐based TSI variations with high fidelity (Fröhlich & Lean, 2004; Kopp & Lean, 2011). For example, the Naval Research Laboratory Total Solar Irradiance (NRLTSI2) model, which the NOAA CDR utilizes to estimate both present and historical irradiance variations (Coddington et al., 2016), inputs a sunspot darkening function calculated from direct observations of sunspot areas and locations on the Sun’s surface and the Mg irradiance index as a facular proxy; the correlation of this model with daily averaged TIM observations (from 2003 to 2016) is 0.96. The Spectral and Total Irradiance Reconstructions (SATIRE) model derives its two sunspot (dark sunspot umbra and penumbra) and two facular (bright faculae and network) inputs from solar magnetograms (Krivova et al., 2010); the correlation of the SATIRE model of TSI with the TIM observations is also 0.96.
The same sunspot and facular solar features that cause total irradiance to vary also influence the spectral irradiance, their net effects being strongly wavelength dependent. The Naval Research Laboratory Solar Spectral Irradiance (NRlSSI2) model specifies solar spectral irradiance for the NOAA CDR with wavelength‐dependent combinations of sunspot and facular indices. The relative strengths of the sunspot and facular influences at different wavelengths are estimated from direct observations made by the Solar Stellar Irradiance Comparison Experiment (SOLSTICE) and SIM on SORCE (Snow et al., 2010). The SATIRE model uses a theoretical model of stellar atmospheres (Unruh et al., 1999) to specify the wavelength dependence of its sunspot and facular inputs. Unresolved instrumental trends thus far preclude observational determination of solar cycle spectral irradiance changes (Lean & DeLand, 2012), except, arguably, for SOLSTICE observations of the brightest and most variable HI Lyman α emission at 121.5 nm. The correlation of the NRLSSI2 model with the daily SOLSTICE SORCE Lyman α irradiance (from 2003 to 2016) is 0.99.
Models of solar irradiance variability such as NRLSSI2 and SATIRE expand and normalize the limited spectral and time domains of the observations. They provide regularly gridded specifications of solar spectral irradiance from the far ultraviolet to the far infrared, and in epochs prior to 1978, in formats suitable for input to climate and atmospheric model simulations (Matthes et al., 2017). To reconstruct historical solar irradiance variations, the models incorporate proxy indicators of the sunspot and facular sources, synergistically for total and spectral irradiance. Direct observations of the areas and locations of sunspots are available since 1882, but sunspot numbers are the only direct indicator of solar activity from 1610 to 1882. The NRLTSI2 and NRLSSI2 models estimate annual irradiance variations from 1610 to 1882 using direct correlations of annual mean sunspot numbers with total and spectral irradiance estimated after 1882. SATIRE algorithmically transforms the sunspot number to estimates of the model’s four separate inputs (dark sunspot umbra and penumbra and bright faculae and network; Kopp et al., 2016; Krivova et al., 2010).
Estimates of solar irradiance prior to 1610 rely on the 10Be and 14C cosmogenic indicators of solar activity extracted from ice cores and tree rings (Delaygue & Bard, 2011; Roth & Joos, 2013; Steinhilber et al., 2012, 2009). Cosmogenic isotopes contain information about solar activity because the Sun is the source of the heliospheric magnetic flux that modulates the flow of galactic cosmic rays that produce these isotopes of gases in Earth’s atmosphere (McCracken et al., 2004, 2013; McCracken & Beer, 2007). Figure 1 shows two different reconstructions of TSI since 850 developed as part of PMIP4, using more recent cosmogenic isotope indices and irradiance variability models than were available at the time of PMIP3. The PMIP4 irradiance reconstructions are synergistic with the absolute scale and variability of the irradiances that Matthes et al. (2017) recommend for use in Intergovernmental Panel on Climate Change’s Sixth Assessment Report simulations, namely, the average of irradiance modeled by NRLTSI2 (total) and NRLSSI2 (spectral) and SATIRE. Of the two different PMIP4 irradiance reconstructions shown in Figure 1, that based on 14C (rather than on 10Be) is specifically recommended for use in the Coupled Model Intercomparison Project (Phase 6) numerical model simulations.
Figure 1 Shown are time series of annual total solar irradiance based on the 14C and 10Be cosmogenic isotopes that the Paleoclimate Model Intercomparison Project recommends for use in simulations of preindustrial climate change (Jungclaus et al., 2017).
Shown are time series of annual total solar irradiance based on the 14C and 10Be cosmogenic isotopes that the Paleoclimate Model Intercomparison Project recommends for use in simulations of preindustrial climate change (Jungclaus et al., 2017).
This paper estimates total and spectral solar irradiance from 850 to 1610 consistent in magnitude and variability with the NOAA Solar Irradiance CDR from 1610 to 2016. In addition to extending the Solar Irradiance CDR prior to 1610, the goal is to provide independent, alternative, irradiance reconstructions for comparison with, and assessment of, the PMIP4 recommendations. The PMIP4 approach converts cosmogenic isotopes to sunspot numbers then calculates solar irradiance prior to 1850 using a SATIRE‐type numerical transformation of this single solar activity index to estimate the model’s four separate inputs. Vieira et al. (2011) report that this simplification of the magnetic flux inputs to the SATIRE model is a major source of uncertainty in its Holocene irradiance reconstructions. In contrast, the current approach estimates solar irradiance prior to 1610 using direct parameterizations of cosmogenic indices with the NOAA Solar Irradiance CDR after 1610.
…
Figure 9
Compared with the Paleoclimate Model Intercomparison Project (PMIP4) recommended times series of annual solar irradiance from 850 to 2016 (orange lines) are the Naval Research Laboratory Total Solar Irradiance (NRLTSI2) and NRLSSI2 modeled values from 1610 to 2016 (black lines) extended from 1610 to 850 using the Roth and Joos (2013) cosmogenic irradiance index. In (a) is total solar irradiance. Solar spectral irradiances in broad bands are shown in (b) at ultraviolet wavelengths from 100 to 400, (c) at visible wavelengths from 400 to 700, and (d) at near‐infrared wavelengths from 700 to 1,000 nm.
https://agupubs.onlinelibrary.wiley.com/doi/full/10.1002/2017EA000357
Abstract
Solar total and spectral irradiance are estimated from 850 to 1610 by regressing cosmogenic irradiance indices against the National Oceanic and Atmospheric Administration Solar Irradiance Climate Data Record after 1610. The new estimates differ from those recommended for use in the Paleoclimate Model Intercomparison Project (PMIP4) in the magnitude of multidecadal irradiance changes, spectral distribution of the changes, and amplitude and phasing of the 11‐year activity cycle. The new estimates suggest that total solar irradiance increased 0.036 ± 0.009% from the Maunder Minimum (1645–1715) to the Medieval Maximum (1100 to 1250), compared with 0.068% from the Maunder Minimum to the Modern Maximum (1950–2009). PMIP4’s corresponding increases are 0.026% and 0.055%, respectively. Multidecadal irradiance changes in the new estimates are comparable in magnitude to the PMIP4 recommendations in the ultraviolet spectrum (100–400 nm) but somewhat larger at visible (400–700 nm) and near‐infrared (700–1,000 nm) wavelengths; the new estimates suggest increases from the Maunder Minimum to the Medieval Maximum of 0.17 ± 0.04%, 0.030 ± 0.008%, and 0.036 ± 0.009% in the ultraviolet, visible, and near‐infrared spectral regions, respectively, compared with PMIP4 increases of 0.17%, 0.021%, and 0.016%. The uncertainties are 1σestimates accruing from the statistical procedures that reconstruct irradiance in the Medieval Maximum relative to the Modern Maximum, not from the specification of Modern Maximum irradiances per se. In the new estimates, solar irradiance cycle amplitudes in the Medieval Maximum are comparable to those in the Modern Maximum, whereas in the PMIP4 reconstruction they are at times almost a factor of 2 larger at some wavelengths and differ also in phase.
Introduction
Solar irradiance is Earth’s primary energy input. It establishes the thermal and dynamical structure of the terrestrial environment and is the primary external cause of terrestrial variability. The specification of solar irradiance over multiple centuries is requisite input for numerical simulations of climate variability prior to the industrial epoch that provide a baseline against which to evaluate contemporary anthropogenic influences. For this purpose, the Paleoclimate Model Intercomparison Projects PMIP3 (Schmidt et al., 2011, 2012) and PMIP4 (Jungclaus et al., 2017) developed reconstructions of the Sun’s total and spectral irradiance since 850 CE that are compatible with the absolute scale and variability of irradiance inputs recommended for climate change simulations in the subsequent industrial epoch (Lean, 2009; Matthes et al., 2017).
Because reliable, accessible, ongoing solar irradiance specifications are necessary for a range of Earth science research and applications, the U.S. National Oceanic and Atmospheric Administration (NOAA) implemented the Solar Irradiance Climate Data Record (CDR, Coddington et al., 2016) in 2015. The Solar Irradiance CDR includes estimates of total and spectral solar irradiance made using models constructed to replicate variations in contemporary space‐based observations. Currently, the NOAA CDR irradiance specifications (v02r01) extend from 1610 to the present but not, as yet, from 850 to 1610.
Continuous space‐based observations of total solar irradiance (TSI) began in late 1978, when the Nimbus 9 satellite carried the Hickey‐Freidan solar radiometer into Earth orbit, followed in 1980 by the launch of the Active Cavity Radiometer Irradiance Monitor on the Solar Maximum Mission. Thereafter, a dozen or more solar radiometers on space‐based platforms have continued the record, including the Total Irradiance Monitor (TIM) on the Solar Radiation and Climate Experiment (SORCE, Rottman, 2005) whose observations enable the model that specifies TSI for the NOAA CDR. Lean (2017) summarizes the space‐based historical irradiance observations; the record continues with the recently launched state‐of‐the‐art TIM of the Total and Spectral Solar Irradiance Sensor (TSIS) on the International Space Station (Richard et al., 2011).
Compared with the database of TSI observations, that of spectral irradiance observations is more limited in temporal coverage, has less certain absolute calibration, and reduced repeatability, especially on decadal time scales. Thus far, spectral irradiance observations over multiple cycles exist only at ultraviolet wavelengths less than 400 nm albeit discontinuously. The launch of the Solar Mesosphere Explorer (Rottman, 2006) in 1980 initiated systematic ultraviolet irradiance observations for a decade. Solar spectroradiometers on the Upper Atmosphere Research Satellite continued the record from 1992 to 2003 (Dessler et al., 1998), on SORCE from 2003 to the present (see Lean, 2017, for overview) and on the International Space Station into the future (Richard et al., 2011). Additional observations of solar spectral irradiance made in pursuit of ozone concentration measurements, such as by the Ozone Monitoring Instrument, also contribute to the solar spectral irradiance database (Marchenko et al., 2016). Systematic, continuous observations of solar spectral irradiance at wavelengths from 400 to 2000 nm exist only since 2003, made by the Solar Irradiance Monitor (SIM, Harder et al., 2009) on SORCE.
Models that combine the influences of the two primary solar sources of irradiance variability, namely dark sunspots and bright faculae, reproduce the observed space‐based TSI variations with high fidelity (Fröhlich & Lean, 2004; Kopp & Lean, 2011). For example, the Naval Research Laboratory Total Solar Irradiance (NRLTSI2) model, which the NOAA CDR utilizes to estimate both present and historical irradiance variations (Coddington et al., 2016), inputs a sunspot darkening function calculated from direct observations of sunspot areas and locations on the Sun’s surface and the Mg irradiance index as a facular proxy; the correlation of this model with daily averaged TIM observations (from 2003 to 2016) is 0.96. The Spectral and Total Irradiance Reconstructions (SATIRE) model derives its two sunspot (dark sunspot umbra and penumbra) and two facular (bright faculae and network) inputs from solar magnetograms (Krivova et al., 2010); the correlation of the SATIRE model of TSI with the TIM observations is also 0.96.
The same sunspot and facular solar features that cause total irradiance to vary also influence the spectral irradiance, their net effects being strongly wavelength dependent. The Naval Research Laboratory Solar Spectral Irradiance (NRlSSI2) model specifies solar spectral irradiance for the NOAA CDR with wavelength‐dependent combinations of sunspot and facular indices. The relative strengths of the sunspot and facular influences at different wavelengths are estimated from direct observations made by the Solar Stellar Irradiance Comparison Experiment (SOLSTICE) and SIM on SORCE (Snow et al., 2010). The SATIRE model uses a theoretical model of stellar atmospheres (Unruh et al., 1999) to specify the wavelength dependence of its sunspot and facular inputs. Unresolved instrumental trends thus far preclude observational determination of solar cycle spectral irradiance changes (Lean & DeLand, 2012), except, arguably, for SOLSTICE observations of the brightest and most variable HI Lyman α emission at 121.5 nm. The correlation of the NRLSSI2 model with the daily SOLSTICE SORCE Lyman α irradiance (from 2003 to 2016) is 0.99.
Models of solar irradiance variability such as NRLSSI2 and SATIRE expand and normalize the limited spectral and time domains of the observations. They provide regularly gridded specifications of solar spectral irradiance from the far ultraviolet to the far infrared, and in epochs prior to 1978, in formats suitable for input to climate and atmospheric model simulations (Matthes et al., 2017). To reconstruct historical solar irradiance variations, the models incorporate proxy indicators of the sunspot and facular sources, synergistically for total and spectral irradiance. Direct observations of the areas and locations of sunspots are available since 1882, but sunspot numbers are the only direct indicator of solar activity from 1610 to 1882. The NRLTSI2 and NRLSSI2 models estimate annual irradiance variations from 1610 to 1882 using direct correlations of annual mean sunspot numbers with total and spectral irradiance estimated after 1882. SATIRE algorithmically transforms the sunspot number to estimates of the model’s four separate inputs (dark sunspot umbra and penumbra and bright faculae and network; Kopp et al., 2016; Krivova et al., 2010).
Estimates of solar irradiance prior to 1610 rely on the 10Be and 14C cosmogenic indicators of solar activity extracted from ice cores and tree rings (Delaygue & Bard, 2011; Roth & Joos, 2013; Steinhilber et al., 2012, 2009). Cosmogenic isotopes contain information about solar activity because the Sun is the source of the heliospheric magnetic flux that modulates the flow of galactic cosmic rays that produce these isotopes of gases in Earth’s atmosphere (McCracken et al., 2004, 2013; McCracken & Beer, 2007). Figure 1 shows two different reconstructions of TSI since 850 developed as part of PMIP4, using more recent cosmogenic isotope indices and irradiance variability models than were available at the time of PMIP3. The PMIP4 irradiance reconstructions are synergistic with the absolute scale and variability of the irradiances that Matthes et al. (2017) recommend for use in Intergovernmental Panel on Climate Change’s Sixth Assessment Report simulations, namely, the average of irradiance modeled by NRLTSI2 (total) and NRLSSI2 (spectral) and SATIRE. Of the two different PMIP4 irradiance reconstructions shown in Figure 1, that based on 14C (rather than on 10Be) is specifically recommended for use in the Coupled Model Intercomparison Project (Phase 6) numerical model simulations.
You must log in or register to see images
Figure 1 Shown are time series of annual total solar irradiance based on the 14C and 10Be cosmogenic isotopes that the Paleoclimate Model Intercomparison Project recommends for use in simulations of preindustrial climate change (Jungclaus et al., 2017).
Shown are time series of annual total solar irradiance based on the 14C and 10Be cosmogenic isotopes that the Paleoclimate Model Intercomparison Project recommends for use in simulations of preindustrial climate change (Jungclaus et al., 2017).
This paper estimates total and spectral solar irradiance from 850 to 1610 consistent in magnitude and variability with the NOAA Solar Irradiance CDR from 1610 to 2016. In addition to extending the Solar Irradiance CDR prior to 1610, the goal is to provide independent, alternative, irradiance reconstructions for comparison with, and assessment of, the PMIP4 recommendations. The PMIP4 approach converts cosmogenic isotopes to sunspot numbers then calculates solar irradiance prior to 1850 using a SATIRE‐type numerical transformation of this single solar activity index to estimate the model’s four separate inputs. Vieira et al. (2011) report that this simplification of the magnetic flux inputs to the SATIRE model is a major source of uncertainty in its Holocene irradiance reconstructions. In contrast, the current approach estimates solar irradiance prior to 1610 using direct parameterizations of cosmogenic indices with the NOAA Solar Irradiance CDR after 1610.
…
You must log in or register to see images
Figure 9
Compared with the Paleoclimate Model Intercomparison Project (PMIP4) recommended times series of annual solar irradiance from 850 to 2016 (orange lines) are the Naval Research Laboratory Total Solar Irradiance (NRLTSI2) and NRLSSI2 modeled values from 1610 to 2016 (black lines) extended from 1610 to 850 using the Roth and Joos (2013) cosmogenic irradiance index. In (a) is total solar irradiance. Solar spectral irradiances in broad bands are shown in (b) at ultraviolet wavelengths from 100 to 400, (c) at visible wavelengths from 400 to 700, and (d) at near‐infrared wavelengths from 700 to 1,000 nm.
https://agupubs.onlinelibrary.wiley.com/doi/full/10.1002/2017EA000357
Specially for Sis
Bull sharks and bottlenose dolphins are moving north as the ocean warms
The migration of marine predators could alter food webs in their newly adopted ecosystems
BY
ALLIE WILKINSON
11:52AM, MAY 2, 2018
BIG LEAP Bottlenose dolphins were spotted in 2017 in the waters of the Canadian Pacific Ocean following a period of warming. It was the first sighting of the warm-water species so far north.
Far from their usual tropical waters, some 200 bottlenose dolphins and about 70 false killer whales have been spotted off the western coast of Canada’s Vancouver Island. Over on the Atlantic coast, bull sharks have turned a North Carolina estuary into a nursery — a sight more familiar in Florida, until now.
Two new studies highlight the unusual northern sightings of these three ocean predators.“Alone, these sightings could be seen as accidental, or vagrancies,” says marine ecologist Luke Halpin of Halpin Wildlife Research in Vancouver and part of the team tracking the dolphins sighting. “But we're seeing a lot of warm-water species ranging into historically cold North Pacific waters.” Those include dwarf sperm whales (Kogia sima), pygmy sperm whales (Kogia breviceps) and short-finned pilot whales (Globicephala macrorhynchus) documented by other researchers.
The results suggest that these marine species will increasingly migrate outside of their typical range as climate change increases ocean temperatures, researchers say.In just the last century, average sea temperatures have risen every decade by 0.07 degrees Celsius, though temperature changes can vary widely by location.
The eastern North Pacific Ocean had experienced a three-year period of warming from 2013 to 2016, and by July 2017, water temperatures about 180 kilometers offshore of Vancouver Island hit 16.5° C. That’s smack in the middle of the range that common bottlenose dolphins (Tursiops truncatus) prefer and at the low end for false killer whales (Pseudorca crassidens).
Typically, bottlenose dolphins aren’t found in offshore waters above Eureka, Calif., and false killer whales don’t venture north of Pismo Beach, Calif. But during a routine seabird and marine mammal survey, Halpin spotted a large herd of the marine mammals off the boat’s stern. He watched for 40 minutes as the dolphins and false killer whales leaped through the water and paused to spyhop, popping their heads up vertically out of the water. At one point, some came within 400 meters of the boat. It was the first time either species had been seen in noncoastal waters of the Canadian Pacific, the researchers report online April 20 in Marine Biodiversity Records.
A similar trend is being seen in the Atlantic Ocean, with baby bull sharks appearing in increasing numbersevery year since 2011 in Pamlico Sound in North Carolina, another research team reports online April 16 in Scientific Reports. Previously, the northernmost nursery for bull sharks (Carcharhinus leucas) had been Florida’s Indian River Lagoon.
NEW NURSERY Baby bull sharks, like this one pictured, have been increasing in numbers in the North Carolina coastal lagoon of Pamlico Sound since 2011.
SMITHSONIAN ENVIRONMENTAL RESEARCH CENTER
But since 2008, water temperatures in early summer, when bull sharks give birth to live young, have exceeded 25° Celsius more than 60 percent of the time in the North Carolina estuary. Salinity also has slowly increased in the sound over the last few decades, from a range of 4.5 to 18.3 parts per thousand in 1971 to 9 to 17.4 parts per thousand since 2011. Young bull sharks are found only in salinities higher than 9 parts per thousand.
Changing conditions in the sound have created “the comfort zone that bull sharks will reproduce in,” says marine ecologist Charles Bangley of the Smithsonian Environmental Research Center in Edgewater, Md., lead author on the shark study.
Migration by these three top-level ocean predators could have consequences for predator-prey relationships, says marine ecologist Rebecca Selden at Rutgers University in New Brunswick, N.J., who was not involved in either of the studies. Dolphins and sharks eat a wide range of prey, so as they move into new areas, prey species there may encounter these larger predators for the first time. That could impact populations of prey species, which in turn could “cause some big ecosystem effects,” she says.
Bull sharks and bottlenose dolphins are moving north as the ocean warms
The migration of marine predators could alter food webs in their newly adopted ecosystems
BY
ALLIE WILKINSON
11:52AM, MAY 2, 2018
You must log in or register to see images
BIG LEAP Bottlenose dolphins were spotted in 2017 in the waters of the Canadian Pacific Ocean following a period of warming. It was the first sighting of the warm-water species so far north.
Far from their usual tropical waters, some 200 bottlenose dolphins and about 70 false killer whales have been spotted off the western coast of Canada’s Vancouver Island. Over on the Atlantic coast, bull sharks have turned a North Carolina estuary into a nursery — a sight more familiar in Florida, until now.
Two new studies highlight the unusual northern sightings of these three ocean predators.“Alone, these sightings could be seen as accidental, or vagrancies,” says marine ecologist Luke Halpin of Halpin Wildlife Research in Vancouver and part of the team tracking the dolphins sighting. “But we're seeing a lot of warm-water species ranging into historically cold North Pacific waters.” Those include dwarf sperm whales (Kogia sima), pygmy sperm whales (Kogia breviceps) and short-finned pilot whales (Globicephala macrorhynchus) documented by other researchers.
The results suggest that these marine species will increasingly migrate outside of their typical range as climate change increases ocean temperatures, researchers say.In just the last century, average sea temperatures have risen every decade by 0.07 degrees Celsius, though temperature changes can vary widely by location.
The eastern North Pacific Ocean had experienced a three-year period of warming from 2013 to 2016, and by July 2017, water temperatures about 180 kilometers offshore of Vancouver Island hit 16.5° C. That’s smack in the middle of the range that common bottlenose dolphins (Tursiops truncatus) prefer and at the low end for false killer whales (Pseudorca crassidens).
Typically, bottlenose dolphins aren’t found in offshore waters above Eureka, Calif., and false killer whales don’t venture north of Pismo Beach, Calif. But during a routine seabird and marine mammal survey, Halpin spotted a large herd of the marine mammals off the boat’s stern. He watched for 40 minutes as the dolphins and false killer whales leaped through the water and paused to spyhop, popping their heads up vertically out of the water. At one point, some came within 400 meters of the boat. It was the first time either species had been seen in noncoastal waters of the Canadian Pacific, the researchers report online April 20 in Marine Biodiversity Records.
A similar trend is being seen in the Atlantic Ocean, with baby bull sharks appearing in increasing numbersevery year since 2011 in Pamlico Sound in North Carolina, another research team reports online April 16 in Scientific Reports. Previously, the northernmost nursery for bull sharks (Carcharhinus leucas) had been Florida’s Indian River Lagoon.
You must log in or register to see images
NEW NURSERY Baby bull sharks, like this one pictured, have been increasing in numbers in the North Carolina coastal lagoon of Pamlico Sound since 2011.
SMITHSONIAN ENVIRONMENTAL RESEARCH CENTER
But since 2008, water temperatures in early summer, when bull sharks give birth to live young, have exceeded 25° Celsius more than 60 percent of the time in the North Carolina estuary. Salinity also has slowly increased in the sound over the last few decades, from a range of 4.5 to 18.3 parts per thousand in 1971 to 9 to 17.4 parts per thousand since 2011. Young bull sharks are found only in salinities higher than 9 parts per thousand.
Changing conditions in the sound have created “the comfort zone that bull sharks will reproduce in,” says marine ecologist Charles Bangley of the Smithsonian Environmental Research Center in Edgewater, Md., lead author on the shark study.
Migration by these three top-level ocean predators could have consequences for predator-prey relationships, says marine ecologist Rebecca Selden at Rutgers University in New Brunswick, N.J., who was not involved in either of the studies. Dolphins and sharks eat a wide range of prey, so as they move into new areas, prey species there may encounter these larger predators for the first time. That could impact populations of prey species, which in turn could “cause some big ecosystem effects,” she says.
Reuters Top 100: Europe's Most Innovative Universities – 2018
By David Ewalt
8 MIN READ
For the third year running KU Leuven tops Reuters ranking of Europe’s most innovative universities, a list that identifies and ranks the educational institutions doing the most to advance science, invent new technologies and power new markets and industries. A Dutch-speaking school based in Belgium's Flanders region KU Leuven was founded in 1425 by Pope Martin V and continually produces a high volume of influential inventions. Patents filed by KU scientists are frequently cited by other researchers in academia and in private industry. That’s one of the key criteria in Reuters’ ranking, which was compiled in partnership with Clarivate Analytics, and is based on proprietary data and analysis of patent filings and research paper citations.
1. The library of the university KU Leuven "Katholieke Universiteit Leuven" is pictured in Leuven, Belgium, June 8, 2016. REUTERS/Francois Lenoir
Overall, the most elite ranks of Europe’s Most Innovative Universities have held steady from last year, with the UK’s Imperial College London (#2) and University of Cambridge (#3) holding onto their top spots for the third straight year. Other leading institutions simply traded a few spaces, like the Federal Polytechnic School of Lausanne (#4, up one), University of Erlangen Nuremberg (#5, up one), and the Technical University of Munich (#6, down two). The remainder of the universities in the top 10 moved up from the teens: The University of Manchester (#7, up nine), University of Munich (#8, up four), Technical University of Denmark (#9, up five), and ETH Zurich (#10, up one).
MORE FROM REUTERS TOP 100Compare Institutions | Methodology
2. Students walk out of the campus of Imperial College London, Britain, May 27, 2016. REUTERS/Toby Melville/File Photo
But even though the usual suspects continue to dominate Europe’s Most Innovative Universities, political uncertainty may be causing a big swing in where innovation happens. The trend is most clear if you consider the sum of changes in rank for each country’s institutions: The 23 German universities on this year’s list cumulatively rose 23 spots, more than any other country. Switzerland was second, with five universities up a total of 8 spots. And in contrast, the list’s 21 UK-based universities dropped a cumulative 35 spots.
Why is this shift occurring? The United Kingdom’s “Brexit” from the European Union is almost a year away, but Europe’s scientific community may already be leaving the UK in favor of research institutions on the continent. A February 2018 study published by the UK-based Centre for Global Higher Education reports that many German academics view Brexit as an “advantage,” and hope to use it to attract UK researchers to German universities; in turn, UK academics report that their own postdocs aren’t seeking positions in the UK and are looking at the EU or United States instead. And as Brexit actually unfolds, it could get worse: A November 2017 study performed by the School of International Futures for the UK’s Royal Society describes a possible post-secession United Kingdom where universities compete for a shrinking pool of skilled workers, projects that used to receive EU funding wither, researchers receive fewer invites to join consortia and attend conferences, and overseas collaboration is limited. Similarly, EU-based businesses that fund research at universities may prefer to keep their investments within the region in order to avoid the tax and regulatory headaches of working with post-Brexit UK institutions.
The government of Germany has also established itself as notably pro-science, increasing federal research budgets and encouraging growth in emerging industries such as renewable energy. (German Chancellor Angela Merkel actually holds a doctorate in quantum chemistry, and worked as a research scientist before she entered politics.) According to a 2017 analysis published in the science journal “Nature,” researchers are “flocking to the country,” in part due to the country’s €4.6-billion “Excellence Initiative,” which has helped to attract at least 4,000 foreign scientists to Germany since 2005. And in 2016, the German Research Foundation (Deutsche Forschungsgemeinschaft, or DFG), the country’s main funding agency, allocated a record €2.9 billion in grants, posting a success rate for individual grant proposals higher than comparable UK rates.
Slideshow (8 Images)
This year’s university ranking also shows how smaller countries can have an outsized presence in the world of innovation. Belgium has seven schools on the list, but with a population of only 11 million people, it can boast more top 100 innovative universities per capita than any other country in Europe. On the same per capita basis, the second most innovative country on the list is Switzerland, followed by Denmark, the Netherlands, and the Republic of Ireland. And some large countries underperform despite bigger populations and economies. Russia is Europe’s most populous country and boasts the region’s fifth largest economy, yet none of its universities count among the top 100.
To compile the ranking of Europe’s most innovative universities, Clarivate Analytics (formerly the Intellectual Property & Science business of Thomson Reuters) began by identifying more than 600 global organizations that published the most articles in academic journals, including educational institutions, nonprofit charities, and government-funded institutions. That list was reduced to institutions that filed at least 50 patents with the World Intellectual Property Organization in the period between 2011 and 2016. Then they evaluated each candidate on 10 different metrics, focusing on academic papers (which indicate basic research) and patent filings (which point to an institution’s ability to apply research and commercialize its discoveries). Finally, they trimmed the list so that it only included European universities, and then ranked them based on their performance.
Of course, the relative ranking of any university does not provide a complete picture of whether its researchers are doing important, innovative work. Since the ranking measures innovation on an institutional level, it may overlook particularly innovative departments or programs: a university might rank low for overall innovation but still operate one of the world’s most innovative oncology research centers, for instance. And it’s important to remember that whether a university ranks at the top or the bottom of the list, it’s still within the top 100 on the continent: All of these universities produce original research, create useful technology and stimulate the global economy.
Very worrying trend.
Reuters Top 100: Europe's Most Innovative Universities – 2018
By David Ewalt
8 MIN READ
For the third year running KU Leuven tops Reuters ranking of Europe’s most innovative universities, a list that identifies and ranks the educational institutions doing the most to advance science, invent new technologies and power new markets and industries. A Dutch-speaking school based in Belgium's Flanders region KU Leuven was founded in 1425 by Pope Martin V and continually produces a high volume of influential inventions. Patents filed by KU scientists are frequently cited by other researchers in academia and in private industry. That’s one of the key criteria in Reuters’ ranking, which was compiled in partnership with Clarivate Analytics, and is based on proprietary data and analysis of patent filings and research paper citations.
1. The library of the university KU Leuven "Katholieke Universiteit Leuven" is pictured in Leuven, Belgium, June 8, 2016. REUTERS/Francois Lenoir
Overall, the most elite ranks of Europe’s Most Innovative Universities have held steady from last year, with the UK’s Imperial College London (#2) and University of Cambridge (#3) holding onto their top spots for the third straight year. Other leading institutions simply traded a few spaces, like the Federal Polytechnic School of Lausanne (#4, up one), University of Erlangen Nuremberg (#5, up one), and the Technical University of Munich (#6, down two). The remainder of the universities in the top 10 moved up from the teens: The University of Manchester (#7, up nine), University of Munich (#8, up four), Technical University of Denmark (#9, up five), and ETH Zurich (#10, up one).
MORE FROM REUTERS TOP 100Compare Institutions | Methodology
2. Students walk out of the campus of Imperial College London, Britain, May 27, 2016. REUTERS/Toby Melville/File Photo
But even though the usual suspects continue to dominate Europe’s Most Innovative Universities, political uncertainty may be causing a big swing in where innovation happens. The trend is most clear if you consider the sum of changes in rank for each country’s institutions: The 23 German universities on this year’s list cumulatively rose 23 spots, more than any other country. Switzerland was second, with five universities up a total of 8 spots. And in contrast, the list’s 21 UK-based universities dropped a cumulative 35 spots.
Why is this shift occurring? The United Kingdom’s “Brexit” from the European Union is almost a year away, but Europe’s scientific community may already be leaving the UK in favor of research institutions on the continent. A February 2018 study published by the UK-based Centre for Global Higher Education reports that many German academics view Brexit as an “advantage,” and hope to use it to attract UK researchers to German universities; in turn, UK academics report that their own postdocs aren’t seeking positions in the UK and are looking at the EU or United States instead. And as Brexit actually unfolds, it could get worse: A November 2017 study performed by the School of International Futures for the UK’s Royal Society describes a possible post-secession United Kingdom where universities compete for a shrinking pool of skilled workers, projects that used to receive EU funding wither, researchers receive fewer invites to join consortia and attend conferences, and overseas collaboration is limited. Similarly, EU-based businesses that fund research at universities may prefer to keep their investments within the region in order to avoid the tax and regulatory headaches of working with post-Brexit UK institutions.
The government of Germany has also established itself as notably pro-science, increasing federal research budgets and encouraging growth in emerging industries such as renewable energy. (German Chancellor Angela Merkel actually holds a doctorate in quantum chemistry, and worked as a research scientist before she entered politics.) According to a 2017 analysis published in the science journal “Nature,” researchers are “flocking to the country,” in part due to the country’s €4.6-billion “Excellence Initiative,” which has helped to attract at least 4,000 foreign scientists to Germany since 2005. And in 2016, the German Research Foundation (Deutsche Forschungsgemeinschaft, or DFG), the country’s main funding agency, allocated a record €2.9 billion in grants, posting a success rate for individual grant proposals higher than comparable UK rates.
Slideshow (8 Images)
This year’s university ranking also shows how smaller countries can have an outsized presence in the world of innovation. Belgium has seven schools on the list, but with a population of only 11 million people, it can boast more top 100 innovative universities per capita than any other country in Europe. On the same per capita basis, the second most innovative country on the list is Switzerland, followed by Denmark, the Netherlands, and the Republic of Ireland. And some large countries underperform despite bigger populations and economies. Russia is Europe’s most populous country and boasts the region’s fifth largest economy, yet none of its universities count among the top 100.
To compile the ranking of Europe’s most innovative universities, Clarivate Analytics (formerly the Intellectual Property & Science business of Thomson Reuters) began by identifying more than 600 global organizations that published the most articles in academic journals, including educational institutions, nonprofit charities, and government-funded institutions. That list was reduced to institutions that filed at least 50 patents with the World Intellectual Property Organization in the period between 2011 and 2016. Then they evaluated each candidate on 10 different metrics, focusing on academic papers (which indicate basic research) and patent filings (which point to an institution’s ability to apply research and commercialize its discoveries). Finally, they trimmed the list so that it only included European universities, and then ranked them based on their performance.
Of course, the relative ranking of any university does not provide a complete picture of whether its researchers are doing important, innovative work. Since the ranking measures innovation on an institutional level, it may overlook particularly innovative departments or programs: a university might rank low for overall innovation but still operate one of the world’s most innovative oncology research centers, for instance. And it’s important to remember that whether a university ranks at the top or the bottom of the list, it’s still within the top 100 on the continent: All of these universities produce original research, create useful technology and stimulate the global economy.
Very worrying trend.
IMO its a medium term issue in that this advantage is driving fear and there are years of what will happen stuff to allow universities to ramp up and attract people out.
In the long term i think This will switch back and UK can attract anyone they want at big wages to uk but they will have moved so its about retention in medium term and long term ensuring poepel can settle on some system where they are wanted not just held on a short term visa or something
The standard of living is high in europe. its not like there no place for them to go. If european universities can create the facilities for the research i can see it being tough to get back.
Posts Guardian link in response from paper from J. L. Lean who's previous work 'Lean 2002' is used by NOAA and the IPCC climate models for historical paleo TSI for 18 years.
") NOAA actually cite the author's work
NOAA actually cite the author's workPublication summary of the NODC Ocean Climate Laboratory, 1982-2017
You must log in or register to see images
https://www.nodc.noaa.gov/OC5/indpub.html
Junk Guardian link, you know no one will click, as opposed to peer reviewed scientific paper from an author who's work is used by the IPCC and
You must log in or register to see images
You must log in or register to see images
Go back to school. Then learn how to read, then learn how to understand scientific method. When you do, you will see AGW does not follow scientific method [HASHTAG]#sillyboy[/HASHTAG]
You are an embarrassment.
Naval Research Laboratory Total Solar Irradiance (NRLTSI2) and NRLSSI2 modeled values from 1610 to 2016
Overlaid with sunspot observations 1600 to 1000 for Visible and NIR. We only have 400 years and the correlation smashes the CO2 correlation to pieces
You must log in or register to see images
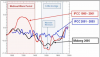
IPCC 1990 time series, vs IPCC 2001 vs Molberg 2005
The IPCC clearly used the hockey stick in an attempt to revise history. The Little Ice age was the lowest time in TSI AND Solar activity in the last 1000 years, and CO2 does not correlate AT ALL unless you flatten out temperatures with hockeystick fraud. We are back to Holocene levels of activity and warming from 1940s to 2000 ish, and now back down again, and of course the correlation is infinitely better than 0.04% of the atmosphere, or our 0.0001 mole fraction addition to it. Solar activity even correlates extremely well for the last 15 years as well as 400 years, and using TSI paleo modeling, 10000 years.
You must log in or register to see images
Ironically you think the variance in TSI is too small from that ball of fire that actually keeps everything warm and alive, at the same time claiming our 0.0001% addition to the atmosphere is so powerful that it will doom us all

people and temperature [HASHTAG]#doom[/HASHTAG] Warming = natural & good, unless you are a completely illiterate moron
You must log in or register to see images
[HASHTAG]#smAshtro[/HASHTAG]
Attachments

Last edited:
Posts Guardian link in response from paper from J. L. Lean who's previous work 'Lean 2002' is used by NOAA and the IPCC climate models for historical paleo TSI for 18 years.
It wasn't in response to anything. It's just an article. This thread isn't about you and your scientifically illiterate conspiracy theories.
It wasn't in response to anything. It's just an article. This thread isn't about you and your scientifically illiterate conspiracy theories.
You melon
You're the one talking about "big fossil" conspiracy theories Out of your depth on any area of science, stick to simple goals and points graphs
You must log in or register to see images
Last edited: