LFC Stats and Analytics

  • Please bear with us on the new site integration and fixing any known bugs over the coming days. If you can not log in please try resetting your password and check your spam box. If you have tried these steps and are still struggling email [email protected] with your username/registered email address
  • Log in now to remove adverts - no adverts at all to registered members!
The final full block of 4 games is done.

Block Performance:

You must log in or register to see images

7/12 is not even top 4 form. the foot came completely off in the last 2 games. we played for a total of 30mins inthe two games.

Historical Performance
You must log in or register to see images

For context block 9 was as "bad" as the disappoinment for klopps farewell.
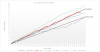

Points Trend
You must log in or register to see images

No longer on for 90.

Performance v Bottom half teams
Games played 19
Goals scored 51
Goal conceded 16
Games won 17
Games drawn 2
Games lost 0
Win ratio 90%
Draw ratio 10%
Loss ratio 0%
Goals per game 2.68
Goals conceded per game 0.84
Points per game 2.79

this is the bread and butter, this is where the title was won

Performance V Top Half Sides _forest added so this looks ok.)
Games played 14
Games played 17
Goals scored 32
Goal conceded 20
Games won 8
Games drawn 6
Games lost 3
Win ratio 47%
Draw ratio 35%
Loss ratio 18%
Goals per game 1.88
Goals conceded per game 1.2
Points per game 1.76

This is where 7 goals in the last 3 games have just dropped our form massively. 2 losses v fulham and chelsea which were poor and threw 2-0 away v arsenal at home.

nothing on the line but standards, stadnards clearly lost.

Super League Scum Table:

not done here, just one dead rubber game to come. we won the scum league as well as the real league.
Super league 6 table
You must log in or register to see images

Super league 6 V the rest table


Where does this season Compare with 2019/20
You must log in or register to see images


We have 10 less points, actually scored 9 more goals but conceded 7 more


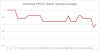
Finally our form, basically good but obviously ruined at the end lol.

You must log in or register to see images
 

Attachments

  • upload_2025-5-12_10-55-36.png
    upload_2025-5-12_10-55-36.png
    16.5 KB · Views: 1
  • upload_2025-5-12_10-56-41.png
    upload_2025-5-12_10-56-41.png
    54.1 KB · Views: 1
  • upload_2025-5-12_10-57-28.png
    upload_2025-5-12_10-57-28.png
    134.2 KB · Views: 1
  • upload_2025-5-12_11-13-22.png
    upload_2025-5-12_11-13-22.png
    8.4 KB · Views: 1
I will do a final super league scum tbale and comparison at the end.

for now.

I did home v away form:

Home:
Games played 18
Goals scored 41
Goal conceded 15
Games won 14
Games drawn 3 (man utd, Fulham and arsenal)
Games lost 1 (forest)
Win ratio 78%
Draw ratio 16%
Loss ratio 6%
Goals per game 2.28
Goals conceded per game 0.83
Points per game 2.50

Away
Games played 18
Goals scored 42
Goal conceded 21
Games won 11
Games drawn 5 (Arsenal, newcastle, forest, everton, villa)
Games lost 2 (fulham, chelsea)
Win ratio 61%
Draw ratio 28%
Loss ratio 11%
Goals per game 2.33
Goals conceded per game 1.2
Points per game 2.11

When you look at it we didn't let any rival really take us to the cleaners but we have thrown points away after it was won. The only "bad" draw was everton which we lead.

Think about it.

Fulham 2-2 Robertson stupidty get himself sent off, a brave battle back (and fulham stopping playing as they do)
Newcastle 3-2 up. Threw away as kelleher didn't want to risk an easy catch
Man utd 2-1 up. Threw away as slot wouldn't take trent off.
Fulham 2-3 - Again robertson stupidity. really poor game this but we had a battle at it.
everton 2-1 up and konate nudged, wouldn't just clear the ball before it too. Stupid dropping of points.

Thas 5 results were indivdiual errors cost us 9 to 11 points. This season could actually have been "that good"

As it stands its just an average premier league that wont go down in the history books as anything special. and will be called poor by many, which is their own stupidty talking as theres so many side competing and of a decent standard.
 
You must log in or register to see images

You must log in or register to see images

You must log in or register to see images

You must log in or register to see images

You must log in or register to see images

You must log in or register to see images

You must log in or register to see images

You must log in or register to see images
 
for new stats:

top 6 fixtures

game week match no Home&Away team
1 1 Man Utd Arsenal
2 2 Man City Spurs
3 3 Liverpool Arsenal
4 4 Man City Man Utd
5 5 Arsenal Man City
5 6 Man Utd Chelsea
7 7 Chelsea Liverpool
8 8 Liverpool Man Utd
10 9 Spurs Chelsea
11 10 Man City Liverpool
11 11 Spurs Man Utd
12 12 Arsenal Spurs
13 13 Chelsea Arsenal
16 14 Spurs Liverpool
20 15 Man City Chelsea
21 16 Arsenal Liverpool
22 17 Man Utd Man City
23 18 Arsenal Man Utd
24 19 Spurs Man City
25 20 Liverpool Man City
25 21 Man Utd Spurs
27 22 Spurs Arsenal
28 23 Arsenal Chelsea
30 24 Liverpool Spurs
32 25 Chelsea Man City
33 26 Chelsea Man Utd
33 27 Man City Arsenal
35 28 Man Utd Liverpool
36 29 Liverpool Chelsea
37 30 Chelsea Spurs

Chelsea have a horrid run in
A massive title decider in game week 33. Man city are at home to arsenal.
 
my guess for this season

Bottom half teams (order that we play them not league order)

Bournemouth
Burnley
Everton
Crystal Palace
Brentford
West Ham
Sunderland
Leeds
Wolves
Fulham

why?

Fulham and Bournemouth are the controversial ones.
Palace always end up bottom half for some reason

The bottom 6 are easy.
Leeds
sunderland
Burnely
wolves
Brentford
West ham

this leave 4 that are not so sure. Everton Bournemouth, Palace and fulham

The reason why they are marked bottom half so far is this top half (again in order of when we play them first)
Newcastle
Arsenal
Chelsea
Man Utd
Aston villa
Man City
Notts Forest
Brighton
Spurs

IMO we can already see the two flops last year should be top half. villa shouldn't fall apart. Forest don't look like it yet and then that leaves brighton to fight for the scraps on only league games and thats an advantage over some.

I'm sure someone will be shokcing and someone will be a surprise packge but i'm going to work on this basis. up to the mid point of the season and then adjust.
 
Klopps average Points total over 7 full seasons was 83 points.

the mode of the data is 82 points.

The 75% quartile is 96 and the 25% quartile is 71, the outliers are 99 points and 67 points.

Slot hit 84 in year 1 and took 2 points form 15 at the end which was "pathetic" so if he can go 90+ this season with a much changed side he will have done very well IMO.

bascially 84 would have been expected out of a functioning klopp side.

Slot has been backed to change up the players he didn't like or replace those who left. the side is a 64/36 going forward with 75% of players being klopp

Alisson
Frimpong
Konate
VVD
Kerkez
Graveberch
Macallister
Wirtz
Salah
gakpo
Ekitike

If we get guehi and isak they probably both won't playin the first 11 from the off.

Robertson, szoboszlai and jones will be go to subs with cheisa hanging about too.

Yes its a bit of change in 3 positions but its not that big a change to fear a massive drop off nor a big enough change to expect the side to be radically better (that a side that shoudl have got 90+ points after all)
 
I dont usually do the stats after block 1 but one thing of note is that this is our first perfect opening block since 2019/20 and 2018/19.

We have started well with 9s and 10s out of 12 but this is first perfect block in 6 seasons.

Just to note as well last season we got 12 points in the second block which was also a rarity, we did that in 19/20 too.

Looking forward getting 9/12 in the next 4

Everton h
Palace a
Chelsea a
Man utd have

Well I think 8/12 would be good let along more.
 
  • Like
Reactions: InBiscanWeTrust