Which is why I’m discussing nothing premier league related until it gets done or not
I'd send Joseph out on loan if we go up.
Which is why I’m discussing nothing premier league related until it gets done or not
They've had a lot of plaudits for their defence and their run of clean sheets. That's fair, they were defensively excellent in the two games vs us. Esteve is a great centre half and the keeper Trafford is also an exceptional talent. However, after watching them multiple times this season I can assure you that their goal has led a very charmed life with multiple golden chances missed at key moments.
I'm sure someone will post some stats to back this up bit purely from an eye test they've been fortunate to only lose 2 games.
Sure, it’s simplistic (I thought you’d appreciate it)
I’m using the ‘best’ teams in the championship as a benchmark for the 3 of us, completely agree it MIGHT Be that what is required to be good in here is not what is required up there.
I think I’m right about Sheffield having no chance on Monday though. We’ll see!

I'd send Joseph out on loan if we go up.

If Bamford is fit, would you start him in the PL over Piroe?

True100% agree that the simpler the argument the better for me.
Burnley strong favourites on current form but Sheffield united do have a chance. Football innit.
Its non league today and play off semis mwakefield at home one game shoot out. No extra time if drawing and straight to penalties.
If we start with either Farke needs sacking or we need to be truly depressed that the board haven’t backed the coachIf Bamford is fit, would you start him in the PL over Piroe?
I would, Piroe can’t be good enough for the prem.If Bamford is fit, would you start him in the PL over Piroe?
They've had a lot of plaudits for their defence and their run of clean sheets. That's fair, they were defensively excellent in the two games vs us. Esteve is a great centre half and the keeper Trafford is also an exceptional talent. However, after watching them multiple times this season I can assure you that their goal has led a very charmed life with multiple golden chances missed at key moments.
I'm sure someone will post some stats to back this up bit purely from an eye test they've been fortunate to only lose 2 games.
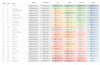
So, should we have been promoted already by now based on this????There you go Emu, expected stats for the top 3 teams. Anything boxed in RED, means the actual results was better than expected stats suggested, whilst anything in GREEN means the actual results was worse than expected stats suggested. Of course anything not highlighted means the result went as stats would expect.
Burnley have 5 games where stats would suggest they should have earned more points, whilst they also have 10 games where stats suggest they should have earned less points.
Sheff Utd have 7 games where stats suggest they should have earned more points in those games, whilst they have 14 games that stats suggest they earned more points than would have been expected. This is more notable in their away performances.
Obviously for ourselves, then most actual results have reflected the the expected result, although for reasons that I think have been well discussed on numerous occasions, we have had more results go against us than stats highlight. We have picked up 6 points away from home more than expected with our wins against Middlesborough, Sheff United and Sheff Weds, with stats suggesting that all those games should have been a draw, when in reality we got wins.
11 games stats show that we should have gained more points than we actually did. Again our goalkeeping issues account for a fair number of these, but our inability to put the ball in the back of the net also accounts for a high number.
BURNLEY
You must log in or register to see images
The home game against Coventry shouldnt be highlighted, the result was as expected. In total, based upon stats alone, Burnley should have won 5 more games that they ended up drawing, won 5 games they should have drawn, drawn 1 game they should have lost and won 4 games they should have lost., so they have 13 more points than expected on a game by game basis. I know the expected points table that sites produce show that they have 20 more points than expected, but I prefer the game by game analysis instead
Sheffield United
You must log in or register to see images
The away game against WBA is colour coded wrong, this should be green not red, as Sheff Utd should have won this based upon stats, as opposed to getting a draw
Leeds United
You must log in or register to see images
So, should we have been promoted already by now based on this????
In simple terms yes.
Going by the expected points table, we have 2 points less than expected, however would also be 20 points ahead of 2nd placed Coventry.
Sorry can't post the image as I'm replying via phone but select link below and choose expected as opposed to actual to see the table based on just stats
https://theanalyst.com/competition/english-championship/table
there are several xg sites with there own data/algorithms - I use footballxg - results a bit different to yours Aski but say the same thing. When I tell everyone we should be 20 points clear this is what I quote from:
https://footballxg.com/xg-league-tables/
if you look at the xg for and against… it’s the against category that sheff united and particularly Burnley have over performed. Our xg against is roughly equivalent to our actual goals against. Burnley should have conceded more than us but as we know, they’ve actually conceded considerably less… combination of Good keeping and bad finishing from the opposition.
My head hurtsThere you go Emu, expected stats for the top 3 teams. Anything boxed in RED, means the actual results was better than expected stats suggested, whilst anything in GREEN means the actual results was worse than expected stats suggested. Of course anything not highlighted means the result went as stats would expect.
Burnley have 5 games where stats would suggest they should have earned more points, whilst they also have 10 games where stats suggest they should have earned less points.
Sheff Utd have 7 games where stats suggest they should have earned more points in those games, whilst they have 14 games that stats suggest they earned more points than would have been expected. This is more notable in their away performances.
Obviously for ourselves, then most actual results have reflected the the expected result, although for reasons that I think have been well discussed on numerous occasions, we have had more results go against us than stats highlight. We have picked up 6 points away from home more than expected with our wins against Middlesborough, Sheff United and Sheff Weds, with stats suggesting that all those games should have been a draw, when in reality we got wins.
11 games stats show that we should have gained more points than we actually did. Again our goalkeeping issues account for a fair number of these, but our inability to put the ball in the back of the net also accounts for a high number.
BURNLEY
You must log in or register to see images
The home game against Coventry shouldnt be highlighted, the result was as expected. In total, based upon stats alone, Burnley should have won 5 more games that they ended up drawing, won 5 games they should have drawn, drawn 1 game they should have lost and won 4 games they should have lost., so they have 13 more points than expected on a game by game basis. I know the expected points table that sites produce show that they have 20 more points than expected, but I prefer the game by game analysis instead
Sheffield United
You must log in or register to see images
The away game against WBA is colour coded wrong, this should be green not red, as Sheff Utd should have won this based upon stats, as opposed to getting a draw
Leeds United
You must log in or register to see images
Yes in time added on as well notveven a corner. Ref overuled the lino and they scored.Oh dear...
Wakefield 0 Dearne & District 1